BTC / USDTWeekly
The decision zone between support and resistance
01 · Context
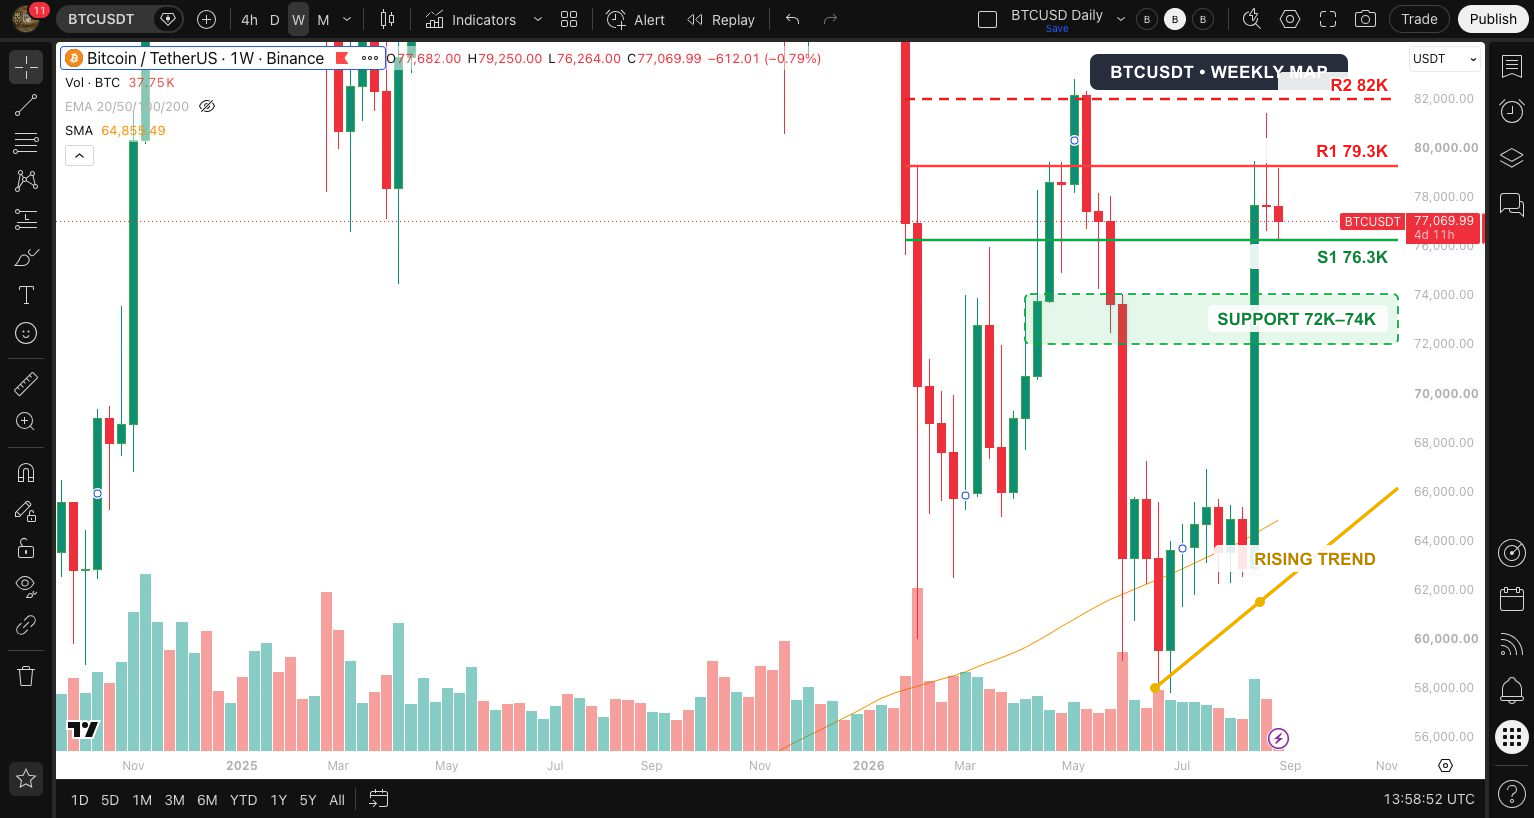
Price is holding above a rising trend structure, but remains below clearly defined weekly resistance. That creates a decision area rather than a clean trend continuation.
02 · Key zones
The chart marks resistance near 79.3K and 82K, immediate support near 76.3K and a broader support zone between 72K and 74K. Zones matter more than a single exact tick.
03 · Scenarios
Acceptance above resistance would strengthen the bullish case. Rejection and loss of support would shift attention towards the lower zone. Until confirmation, patience is a position.
This is a dated educational case study, not a live trading instruction. Market conditions may have changed, and the chart does not account for your objectives, finances or risk tolerance.